Jan Maarten Vrij, Shawna Morris, Gilles Froment, Jurgen Janssen, Jennifer Huet, Melanie Richard, Veronique Pilet and Caroline Emond
The International Dairy Federation
Introduction
The aim of this paper is to examine the progress of milk production and demand, and its contribution to the Dairy Declaration and the Sustainable Development Goals (SDG’s), defined within the UN Agenda 2030. For this reason, four indicators, total milk demand, per capita demand, milk production (cow and buffalo), and average milk yield (cow and buffalo), are monitored within a seven-year time period (2010-2017). Developments are tracked at the global level. In addition, some regional statistics have been included as well, in order to provide illustrative examples of regions showing data markedly higher than the global mean (see Annex for further regional details).
The contribution of dairy production and demand growth to the SDG’s
Concerning the Agenda 2030, agriculture and consequently dairy plays a vital role in accomplishing several of the 17 Sustainable Developments Goals (SDG’s). In examining the development of the different indicators within the time frame of 2010 to 2017, substantial progress related to certain goals can be identified.
Goal 1 No poverty
Between 2010 and 2017 production growth was tracked globally, increasing by an estimated 120 million tonnes of milk, all kinds of milk included, to a level of 849 million tonnes in 2017. Milk production supports good livelihoods, and ultimately the goal of poverty eradication, given the role of dairy farming as both a capital investment and an income stream. Moreover, dairy production, as well as dairy processing, has positive economic impacts through the role production and processing play as job creators, both directly and in the supporting supply chains (IDF, 2014; FAO, GDP and IFCN, 2018).
Goal 2 Zero Hunger
As examined, between 2010 and 2017 consumption of milk and dairy products increased by 120 million tonnes or 7 kg per capita to a level of 113 kg per capita. This clearly shows the increased accessibility and utilization of nutritious food. As a consequence, progress in fighting hunger and undernourishment is achieved, as high growth rates can be observed, particularly in developing regions. The wider availability of dairy products, as evidenced through higher rates of dairy consumption, also indicate improvements in food security.
Goal 3 Ensure healthy lives
Dairy foods are nutrient rich.Nutrient rich foods like milk, cheese and yoghurt provide a lot of nutrients that the body needs, relative to the amount of energy they provide. The importance of dairy foods as part of a healthy diet is reflected in the fact that they are included in dietary recommendations worldwide.
The above-mentioned increase in per capita consumption on a global level, clearly demonstrates progress in ensuring healthy lives. With its high nutritional value, dairy can complement a well-balanced diet and meet essential nutritional needs. Higher levels of animal protein are being accessed by more people around the world, thereby contributing to sound nutrition.
Goal 13 Climate action
Between 2010-2017, the global average annual milk yield increased by more than 200 kg of milk per cow and per buffalo to a level of 2500 kg of milk per cow annually (2000 kg per buffalo), or +9,2% for cows’ milk, +10.5% for buffalo milk. in total. Generally, high yielding cows produce lower CO2 output per unit output (i.e. kg milk), as the maintenance requirements are spread over a larger amount of milk than for low yielding cows. In consequence, a global increase in milk productivity helps to combat climate change and its impacts. In this chapter, milk yield increase has been chosen as one indicator of this. However, the global dairy sector has been pursuing various actions to reduce the output of greenhouse gasses (IDF, 2017).
Dairy declaration in progress
Agenda for Sustainable Development, the dairy community declared its commitment to “The Dairy Declaration of Rotterdam” embracing its role in meeting the demand for sustainably produced products and confirming the vital role of the dairy sector.
As discussed, in examining the progress in milk production, and milk and dairy demand, great steps forward on some of the Agenda’s top goals regarding economic and health dimensions have been made. Between 2010-2017, due to an increased level of total dairy production and demand, a critical contribution on achieving SDGs is visible.
Increased total demand and per capita demand indicate that more people are able to consume dairy products at higher levels, thus contributing to nutritious and healthy diets. Additional demand is enabled and provided by increased production. Moreover, increased milk production and productivity provide a significant contribution to income, employment and the livelihood of farmers. In turn, the milk produced is processed into a variety of dairy products, thereby supporting additional jobs throughout the global value chain. Beyond this, an increased global milk yield is one way in which the dairy sector is participating in combatting climate change.
These are just a few of the ways in which the dairy sector is increasingly operating in a sustainable manner to the benefit of people around the world. More than a target, this is a journey, since at all levels of the dairy chain, the global dairy sector is in a continuous process of stimulating and encouraging next steps in pursuing sustainable methods of operation.
More people are able to consume dairy products at higher levels, thus contributing to nutritious and healthy diets
Milk demand and production developments
a) Total milk demand and per capita demand
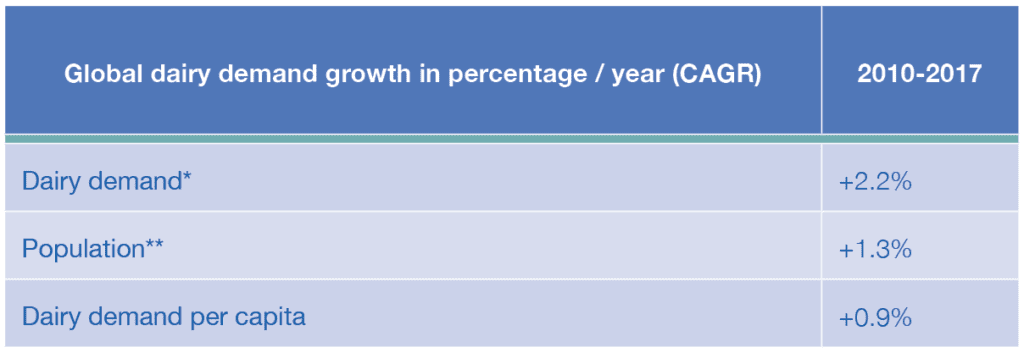
Global milk demand increased by 120 million tonnes of milk (all milk of cow, buffalo, goat, sheep and camel) between 2010 and 2017. Between (2010-2017) milk demand grew by 2.2% per annum (p.a.) on average, tallying a remarkable jump of 16.5%% over that time period (Table 1). Since 2000 the total increase in milk demand has been 46.9%. This demand growth was driven in relatively equal proportions by a hike in per capita demand expansion and by an expanding population. On average, global per capita milk demand increased by 0.9% p.a. and reached a level of 113 kg of milk per capita in 2017. Population growth played a similar role, driving a 1.3% growth rate on average p.a.
Table 1 – Percentage of global dairy demand growth per year in Compound Annual Growth Rate (CAGR) (IDF, 2018; Population Reference Bureau, 2018)
b) Milk production and productivity results
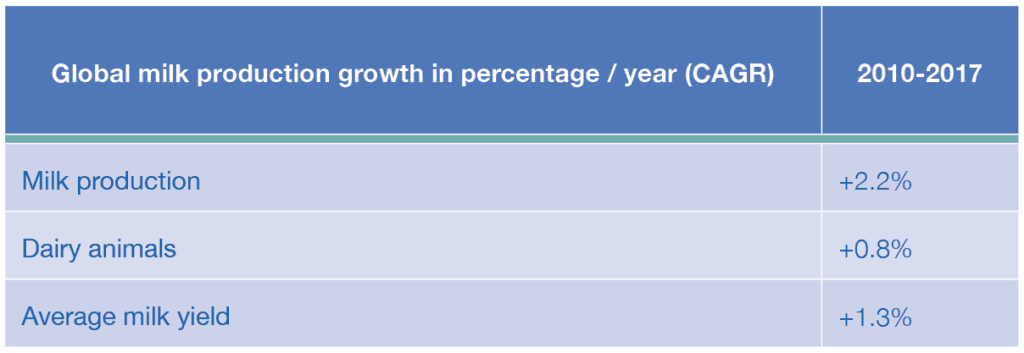
Global milk production (cow and buffalo) increased by 2.2% p.a. in the last seven years (2010-2017), reaching a level of 849 million tonnes of milk in 2017 (Table 2). Average milk yield increased by 1.2% p.a., reaching a level of 2500 kg of milk per cow annually (2000 kg per buffalo). Production growth was driven by the increase in dairy animals and by milk yield growth (IDF, 2018).
Table 2 – Percentage of global milk production growth per yea in Compound Annual Growth Rate (CAGR) (IDF, 2018)
Methodology
When referring to milk and dairy demand, we are discussing apparent consumption. This is due to the fact that no studies of consumption habits based on actual purchases on a global scale are available. Moreover, the informal market accounts for a significant part of the global dairy market. Total consumption can therefore only be assessed using calculations taking into account production, trade, and, where available, stock variation figures.
Demand per capita is calculated by taking milk demand divided by total population.
Calculation of the milk yield: milk production of cows and buffalos is divided by the number of milking animals. Milk production data includes cow and buffalo milk production.
In light of absence of an agreed IDF methodology pertaining to the calculation of milk equivalents, the methodology utilized by FAO is here employed for the purpose of this report. FAO calculates milk equivalents by using conversion factors based on the following solid content method: 6.6 for butter, 4.4 for cheese, 7,6 for skim/whole milk powder, 1.9 for skim condensed/evaporated milk, 2.1 for whole condensed/evaporated milk, 1.0 for yoghurt, 3.6 for cream, 7.4 for casein, 0.7 for skim milk, 1.0 for liquid milk and 7.6 for dry whey.
Increased milk production and productivity provide a significant contribution to income, employment and the livelihood of farmers and on additional jobs throughout the global value chain
Dairy demand
The key findings are:
Global demand of milk and dairy products increased in absolute numbers by 120 million tonnes of milk (2017 vs. 2010), reaching a level of 851 million tonnes in 2017.
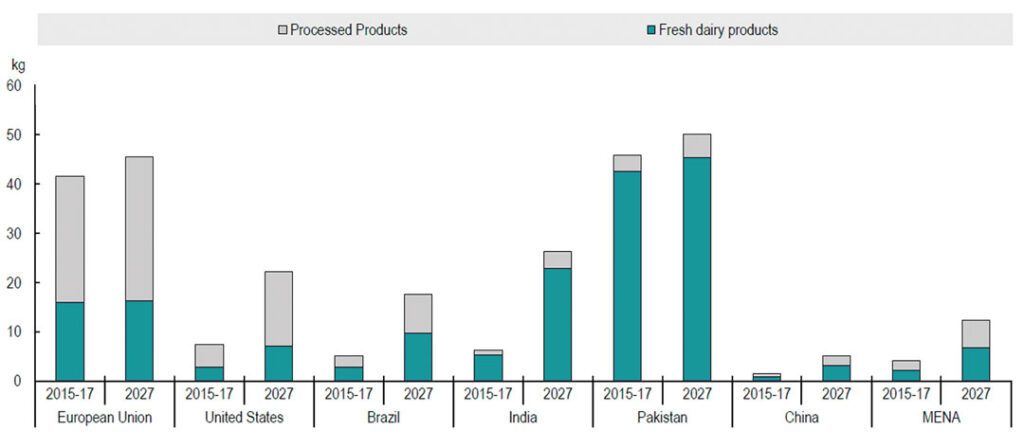
Developments differed significantly by region (Figure 1). For example: in developing countries fresh dairy products are predominantly consumed, while in contrast in developed countries consumer preferences tend towards manufactured products such as cheese (OECD-FAO Agricultural Outlook 2018-2027)
Within 7 years (from 2010 to 2017), total milk demand increased by 16.5% This represents an average annual increase of 2.2%.
The total demand growth of 16.5% increased by through a combination of population growth (9%) and growth in capita demand (7%).
Figure 1 – Per capita consumption of processed and fresh dairy products in milk solids (Milk solids are calculated by adding the amount of fat and non-fat solids for each product; Processed products include butter cheese, skim milk powder and whole milk powder). (OECD and FAO, 2018)
Per capita demand
The key findings are:
Global per capita demand of milk and dairy products increased by 7 kg per capita/year (2017 vs. 2010), reaching a level of 113 kg per capita/year.
Within 7 years (2010 to 2017), global per capita demand increased by a total of 7%. This is an average annual increase of 0.9%.
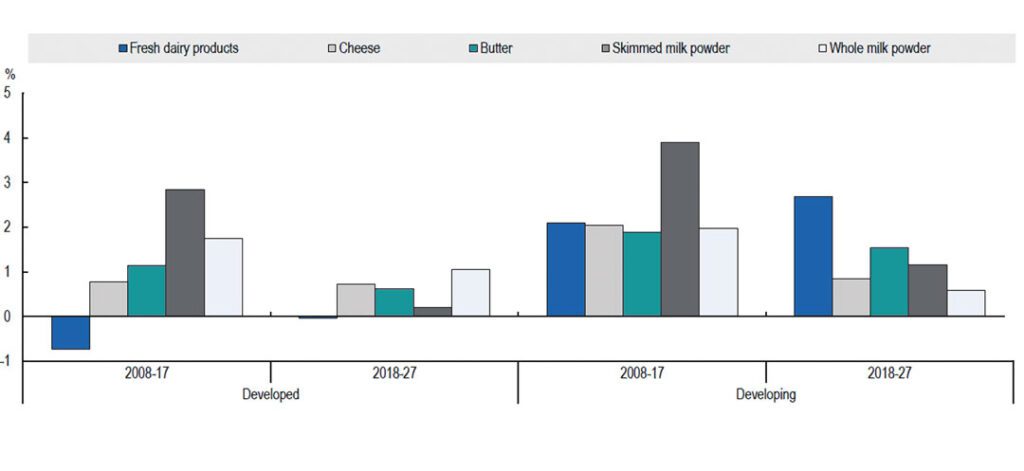
From the OECD-FAO Agricultural Outlook 2018-2027 it can be concluded that (Figure 2):
Between 2008 and 2017, annual growth rates of per capita consumption for nearly all product categories were substantially higher in developing countries than in developed countries, albeit starting from lower levels;
Highest growth in developing countries was observed for skimmed milk powder (+3.90% p.a.) and fresh dairy products (+2.09% p.a.);
While skim milk powder also flourished in developed countries (+2.84%p.a.), in contrast with this, fresh dairy products showed a negative development in the developed countries (-0,73% p.a.)
Within 7 years, 2010 to 2017, global per capita demand increased on total by 7%. This is an average annual increase of 0.9%.
Figure 2 – Annual growth rates of per capita consumption for dairy products (OECD and FAO, 2018)
Milk production cow and buffalo
The key findings are:
Global milk production of all kinds increased by 120 million tonnes of milk from 2010 to 2017, reaching a level of 849 million tonnes in 2017.
An increase of milk production (cow and buffalo) by 75 million tonnes, which is equal to two thirds of the absolute global increase, was generated by Asia.
An increase of milk production (cow and buffalo) of 16 million tonnes, which is equal to 13% of the absolute global increase, was generated by the European Union.
Within 7 years (2010 to 2017), total milk production (cow and buffalo) increased by a total of 16%. This is an average annual increase of 2.2%. In Asia, milk production growth was disproportionally higher than the global average, tallying 3.8% in that region.
The total production growth of 16% was driven by a combination of milk yield growth (9%) and by increased cow and buffalo numbers (7%).
Average milk yield of cows and buffalos
The key findings are (IDF, 2018; OEDE and FAO, 2018):
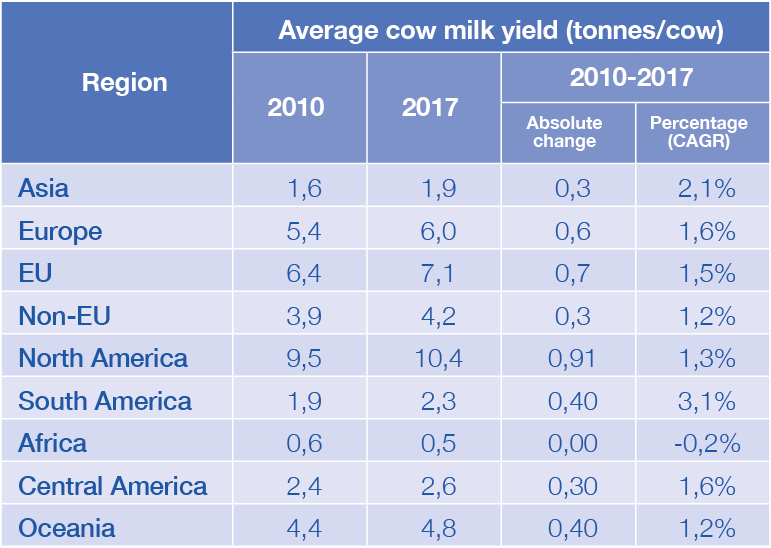
Global milk yield increased by 0.2 tonne per cow and buffalo (2017 vs. 2010), reaching a level of 2 and 2.5 tonne per buffalo and per cow respectively.
The highest increase in milk yield was monitored in North America (898 kg per cow/year).
A small decrease in milk yield was monitored in Africa (-30 kg per cow/year).
Within 7 years (2010 to 2017), global cow’s milk yield increased by a total of 8.5%. This is an average annual increase of 1.3%.
ANNEX
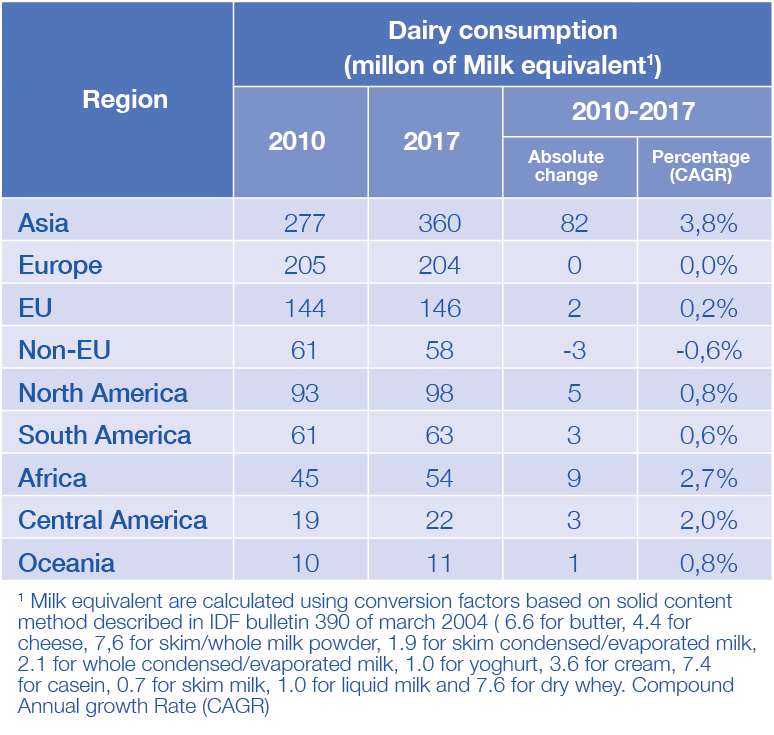
Table 3 – Dairy consumption by region (million tonnes of Milk equivalent). IDF calculation based on FAO outlook June 2011 and June 2018, this apparent consumption calculation doesn’t take into account regional stock variation.
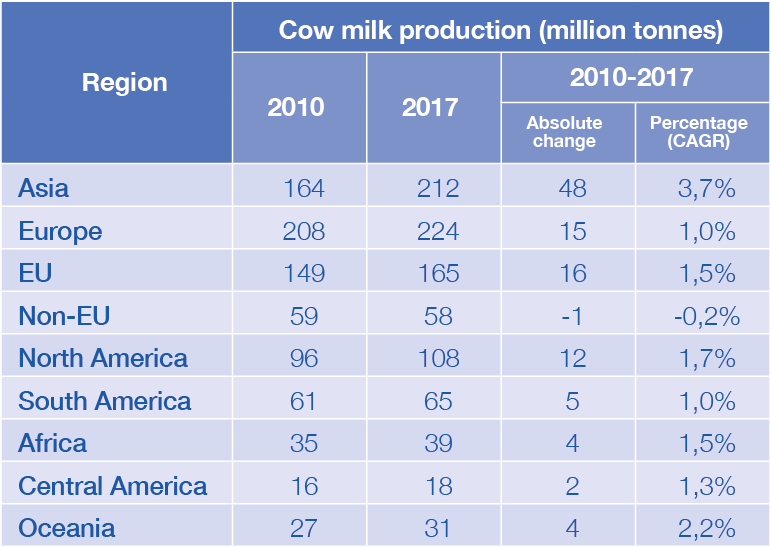
Table 5 – Cow milk production by region (million tonnes) (IDF, 2018)
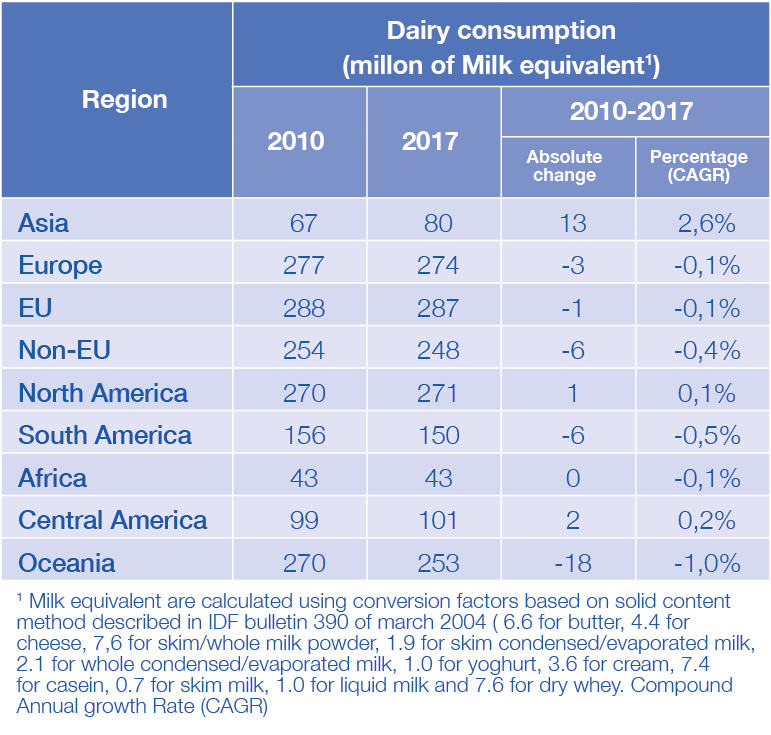
Table 4 – Dairy consumption by region (kg of Milk equivalent per capita per year). IDF calculation based on FAO outlook June 2011 and June 2018, this apparent consumption calculation doesn’t take into account regional stock variation.
Table 6 – Average cow milk yield by region (tonnes/cow) (IDF, 2018)