Share this page
THE NETHERLANDS
Determining the pathway to net zero for Dutch dairy
Alignment with SDGs


AUTHOR
Sanne Dekker, Jeroen Hospers, Lody Kuling, Pablo Modernel, Jan Peter Lesschen, Hans Blonk, Laura Batlle-Bayer, Wilfried van Straalen, FrieslandCampina, The Netherlands, Wageningen University & Research, The Netherlands, 3Blonk Consultants, The Netherlands
Abstract
Our peer review study on the evolution of the carbon footprint of Dutch raw milk unveiled a 35% reduction in the carbon footprint of raw milk between 1990 and 2019. This translates into a reduction of 1.1% per year. The carbon footprint reduction of total Dutch milk delivery was with 15% smaller due to an increase in total Dutch raw milk production.
Introduction
For many years we worked with a team of experts in FrieslandCampina to finding possibilities to reduce the carbon footprint of dairy. However, we never took the time to exactly determine, what had already been achieved in terms of carbon footprint reduction in the past and to learn lessons from that for the future. However, in the process of setting new (science based) 2030 climate targets for the company we finally took up this challenge. An important reason to do this was to show the farmers in our cooperative that they have already achieved a lot. We want our farmers to feel proud and empowered to further reduce the carbon footprint of milk in the future.
In January 2021 we assembled a research team to investigate ‘the evolution of the carbon footprint of Dutch raw milk between 1990 and 2019’ and to have it peer reviewed. The team consisted of four FrieslandCampina experts and four external experts from Wageningen University, Blonk Consultants and Schothorst Feed Research with expertise in the field of carbon footprint, dairy farming, soil carbon modeling and dairy cattle feed composition.
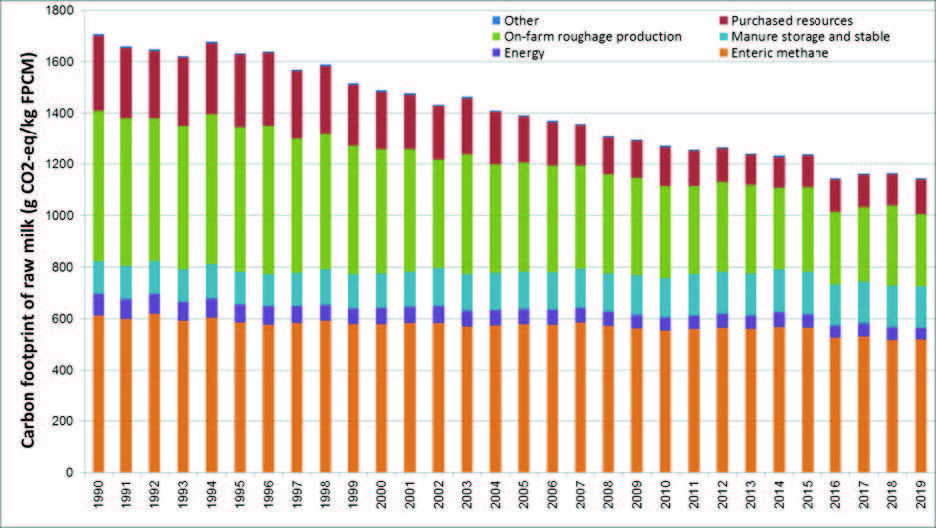
Figure 1. Annual CF of Dutch raw milk between 1990 and 2019 segregated in GHG emission excluding direct land use change and soil organic carbon balance differentiated by the subsystems; enteric methane (orange); roughage production on farm (green); purchased resources (red); manure storage and stable (light blue); energy (purple) and other (dark blue)
Dutch dairy data trends over time
So, after this job was finished, we had a fantastic overview of how the Dutch dairy sector from cradle to farm gate developed between 1990 and 2019 and this was very valuable even without calculating the carbon footprint of the raw milk.
The most obvious trend when looking at the development of Dutch dairy farming between 1990 and 2019 is the increase in dairy farm size and the improvement of production efficiency.
Farms size has increased from 20.8 hectares and 40.6 dairy cows in 1990 to 52 hectares and 97 dairy cows in 2019. Dairy cow performance also improved between 1990 and 2019, i.e., replacement rate decreased from 42%to 29%, milk production increased from 6003 to 8807 kg per cow per year and feed efficiency improved from 1.1 to 1.25 kg fat and protein corrected milk (FPCM) per kg dry matter intake. Because dairy cow efficiency improved, the relative amount of live cattle sold per kg of FPCM sold from the farm halved from ~0.04 in 1990 to 0.02 in 2019. Total milk production in the Netherlands was largely stable hovering around 11700 mil kg per year until 2007 after which it steadily increased. In 2015 the milk quotum was abolished, after which milk delivery peaked in 2016 at 14324 mil kg per year and then reduced again towards 13802 in 2019 due to the implementation of environmental policies to reduce phosphorus pollution. This legislation also had the effect that farmers tried to have as little youngstock on their farms as possible in the last few years. Another substantial change was the reduction in electricity use and compound feed use per kg of milk.
Carbon Footprint mehodology
The functional unit was defined as 1 kg of FPCM at the dairy farm gate in the Netherlands. The life cycle stages included the following: production of resources purchased on the dairy farm, dairy cattle, compound feed, electricity, natural gas, diesel, artificial fertilizers, pesticides, silage plastic and capital goods. Life cycle stages also included the greenhouse gas emissions related to the following dairy farm processes: fertilization, enteric fermentation, manure management, soil carbon balance and combustion of fossil fuels. Global Warming Potentials for a one-hundred-year time horizon (GWP-100) from IPCC (2021) were used to calculate total greenhouse gas emission. This implies a GWP-100 of 27.2 kg CO2-eq. per kg biogenic methane and 273 kg CO2 eq. per kg nitrous oxide. In line with the Product Environmental Footprint Category Rules and IDF guidelines economic allocation was used to divide the environmental impact among multiple outputs in the feed industry and biophysical allocation was used to divide the environmental impact between milk and sold cattle. The study included emissions or removals from land use change (for compound feed production) and the soil carbon balance for dairy farmland.
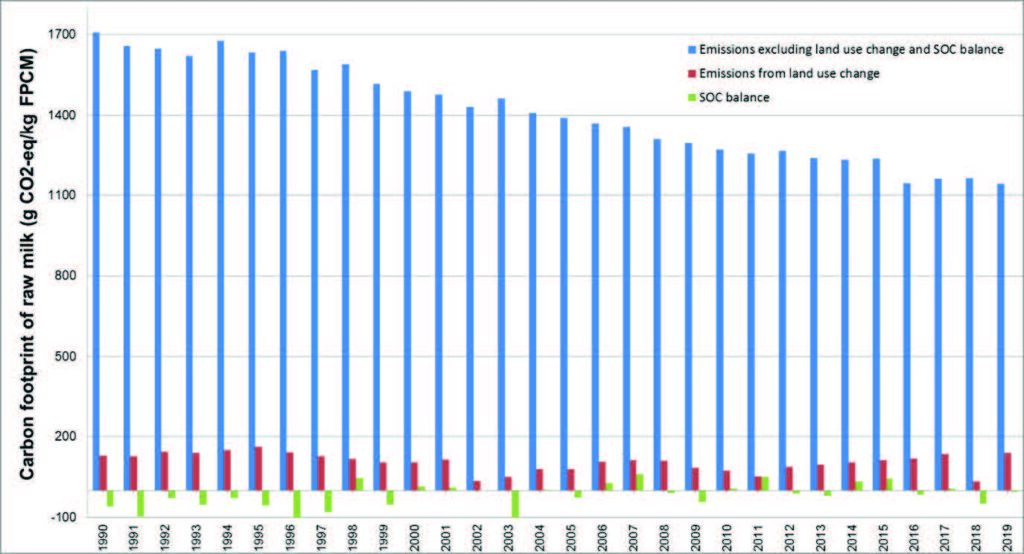
Figure 2. Annual carbon footprint of Dutch raw milk between 1990 and 2019 segregated in GHG emission excluding direct land use change (dLUC) and soil organic carbon (SOC) balance (blue), dLUC (red) and SOC balance (green)
Future pathways for FrieslandCampina
Like other dairy companies, FrieslandCampina has set ambitious raw milk carbon footprint reduction targets. In 2030 FrieslandCampina aims to reduce the carbon footprint of their raw milk 33% compared with 2015, i.e. on average 2,2% per year. This means carbon footprint reduction rate needs to be doubled. The reduction in the past 30 years was mainly
caused by an increase in milk production per cow, milk production per hectare and feed efficiency. Of course, focus on efficiency should be maintained. To accelerate efficiency induced reduction FrieslandCampina has implemented trainings (see here), tools (see here), internal financial rewarding (see here) and sustainability labelling (see here).
Enteric methane emission and methane emission from manure storage remained quite stable over time and together currently makes up ~55% of the carbon footprint. To achieve 2030 targets, therefore the primary focus should be on reducing on farm methane emissions. FrieslandCampina has both research and practical projects in place to achieve this. For example practical projects to reduce enteric emissions by using feed additives (see here) and a collaboration to implement manure digestion (see here).
Challenging Data Collection
The first challenge was to collect all the data needed to calculate the carbon footprint of raw milk over such a long period. We really wanted to make an effort to capture all the different trends and developments over time that affect the carbon footprint. To calculate a carbon footprint you need data over the entire life cycle of a product. As this was a cradle to farm gate carbon footprint study, we had to collect data about Dutch dairy farming, as well as the life cycle of the purchased resources on the farm, such as compound feed, dairy cattle, electricity, natural gas, diesel, artificial fertilizers, pesticides, silage plastic and capital goods. For all variables we needed to know how they had changed over time and how that affected the greenhouse gases emitted while producing them. We managed to incorporate all those trends and variabilities in this study. We dug through all the different statistics available and found good data.
For the purchased compound feed, for example, we needed to determine the changes over time about: how much was used, how the composition changed overtime, which ingredients were used, where the ingredients came from, how the ingredients were grown, their yield and fertilization, how much fuel was used, how the carbon footprint of the fuel and fertilizers changed and how did deforestation develop. Fortunately, Dutch dairy farms are among the most well registered farms in the world. So, we were able to find several sources of farm data about for example farm size, milk yield, herd composition, feed ration, manure and field management.
Something that was not readily available from statistics was the soil C stock or C sequestration development over time. For this the currently best model available was used, the Roth C model, to determine the carbon stock development on Dutch dairy farms over time. The model considers the effects of soil type, temperature, moisture content and soil cover on the decomposition of organic carbon. It was surprising to see how carbon stock on dairy farms changed over such a long period of time and see the huge fluctuations between years due to annually different weather. For the compound feed it was unfortunately impossible to include soil carbon stock changes, because we had to deal with so many different regions, but we were able to include land use change developments in relation to deforestation over time.
Between 1990 and 2019 land management on dairy farms also changed a lot. First, though grazing of cows was maintained, the total time spend by cattle in the meadow decreased. This resulted in a larger part of the dairy manure ending up indoors in the manure storage. Second, around the year 2000 legislation imposed that dairy farms halved the amount of chemical N fertilizer per hectare and also the amount of manure N from fertilizer was reduced. The total amount of N applied per hectare reduced from ~600 kg of N per hectare in 1990 to 330 kg of N per hectare in 2019. Third, though the ratio between maize land (10%) and grassland (90%) on dairy farms remained rather stable over time; grassland use switched from fully permanent grassland in 1990 to partly temporary grassland in 2019.
Farmers renewed the grassland to make it more productive and applying a crop rotation for grass and maize became more common. Fourth, due to enhanced crop breeding and management maize yield per hectare increased drastically from 11.7 tons of dry matter per hectare in 1990 to 14.8 tons of dry matter per hectare in 2019. However, grass yield per hectare remained largely stable. Fifth, milk production per hectare increased from 13 to 18 tons of FPCM per year.
Carbon Footprint Results
The peer review study on the evolution of the carbon footprint of Dutch raw milk unveiled a reduction in the carbon footprint of raw milk of 35% between 1990 and 2019. To identify which part of the production chain contributed most to the carbon footprint, the results were divided in five main subsystems; 1) enteric methane; 2) roughage production on farm; 3) purchased resources; 4) manure storage and stable; and 5) energy use. Enteric methane was the largest contributing subsystem followed by roughage production on farm, purchased resources, manure storage and stable and energy use (Figure 1). Greenhouse gas emission from the subsystem enteric methane decreased with 15%, mainly due to a decrease in the size of the youngstock herd in response to the introduction of phosphate regulations. Greenhouse gas emission from the subsystem roughage production on farm reduced by 52% towards 2019. This reduction was caused by a reduction of nitrogen application rates, increasing roughage yields, reduced manure excretion in the pasture due to less grazing hours and less land use per kg milk due to improved feed efficiency.
Greenhouse gas emission from the subsystem manure storage and stable increased by 26% in the period 1990-2019. The increase resulted from an increasing share of manure excreted in the stable due to less grazing hours. Greenhouse gas emission from the subsystem purchased resources reduced with 54% due to a reduction of the carbon footprint of compound feed and artificial fertilizer and a decrease of fertilizer and compound feed use per kg. of FPCM. Greenhouse gas emission from the subsystem energy production and use decreased with 47%, due to a reduction of the carbon footprint of electricity and less energy use per kg FPCM.
The soil organic carbon balance has decreased over the last 30 years due to a decrease in organic matter application on field and a decrease of permanent pasture area and more milk production per hectare. However, the interannual variability due to weather circumstances is high and the contribution of the soil organic carbon balance to the total carbon footprint is limited.
To assure the reliability of both the absolute carbon footprint and the reduction rate, a sensitivity analysis was performed on the most important methodological choices. Results showed that though the absolute level of carbon footprint was affected by methodological choices, the reduction rate of the carbon footprint was largely unaffected.
FrieslandCampina also works on reduction of the greenhouse gas emissions in their supply chain. To make sure green electricity generation in the Netherlands increases FrieslandCampina has a collaboration with farmers to install solar panels on dairy stables and buy the Renewable Energy Certificates from these farms as a source of green electricity for their factories (see here). Like this electricity use of all FrieslandCampina factories in the Netherlands is green and 60% of this green electricity originates from farmers in the cooperative. However, scaling up many of the above initiatives and finding financial support from outside the company remains challenging.
It was a big effort to collect all the data to determine, what we already knew from experience, that the carbon footprint of Dutch milk had decreased a lot since 1990. This will help the sector in making more concrete efforts to reduce their footprint towards the goal of climate neutrality
Sanne Dekker Tweet