Share this page

Alignment with SDGs

AUTHOR
Olav Østerås, TINE SA • Norway
Abstract
Animal welfare is important in sustainable dairy production. There are many ways to assess animal welfare, and there are different standards. One standard is the Welfare Quality® Assessment protocol for cattle
Other standards are the OIE standard in chapter 7.11 animal welfare and dairy cattle system and ISO standard ISO TS34700:2016: Animal welfare management – General requirements and guidance for organizations in the food supply chain.
The Welfare Quality® Assessment is considered the golden standard in science, however the drawback of this standard is the time needed for proper assessment. The OIE standard is describing what variables that are to be considered in assessment of animal welfare, and ISO is a standard built on the OIE standard, where the industry can set their own goals. In Norway there is a long tradition of animal recording, and the animal recording for dairy cattle also have continuous recording of disease treatments and other parameters as slaughter weights, growth rate, somatic cell counts etc. We recognised that almost half of the variables mentioned in the OIE standard is included in the Norwegian dairy cattle recording system.
This gave us the opportunity to have a continuous assessment of animal welfare indicators by extracting these variables from the already existing animal recording system, and thus have a continuous indication of animal welfare at each farm. The Norwegian Animal Welfare Indicator was born. This new indicator is updated every month and includes data from the last 12 months – a monthly rolling 12 months assessment. Data for all indicators are presented to farmers, advisors in TINE SA and the farm’s veterinarian if the framers give them access to data.
The technical development
The technical development of the Norwegian Animal Welfare Indicator (NAWI) started in 2016 by making a prototype in the statistical programme SAS to evaluate how it could work. The baseline year was the annual data for the year 2015. This means that 2015 is considered the baseline year. All herds are therefore compared to the national mean figures for 2015. From these national figures based on the national mean and standard distribution (STD) there was estimated a normalized standard deviation (NSD). The NSD was calculated as the herd mean minus the national mean divided by the national STD. Two distributions were used, normal distribution or poison distribution. As an example, the national slaughter weight for cows was 269 kg with a STD of 30.5 kg, and a specific herd had a mean slaughter weight for cows at 200 kg the estimate of NSD will be (200-269)/30.5 = -2.26. This figure is just the number of STD in difference from the national mean in 2015. If there as a Poisson distribution like for mastitis treatments the calculation is as follows: The national incidence rate per cow-year was 0.22 in 2015. If there is a herd with 40 cows the expected number from the national mean will be 40 x 0.22 = 8.8 treatments. If there in this herd it was 4 treatments the NSD would be (8.8 – 4)/ (square root of 8.8) = 4.8/2.97= 1.62. These NSD will then be a figure from – 3.0 to + 3.0. If the calculation is outside this area the figures will be truncated to -3.0 or +3.0.
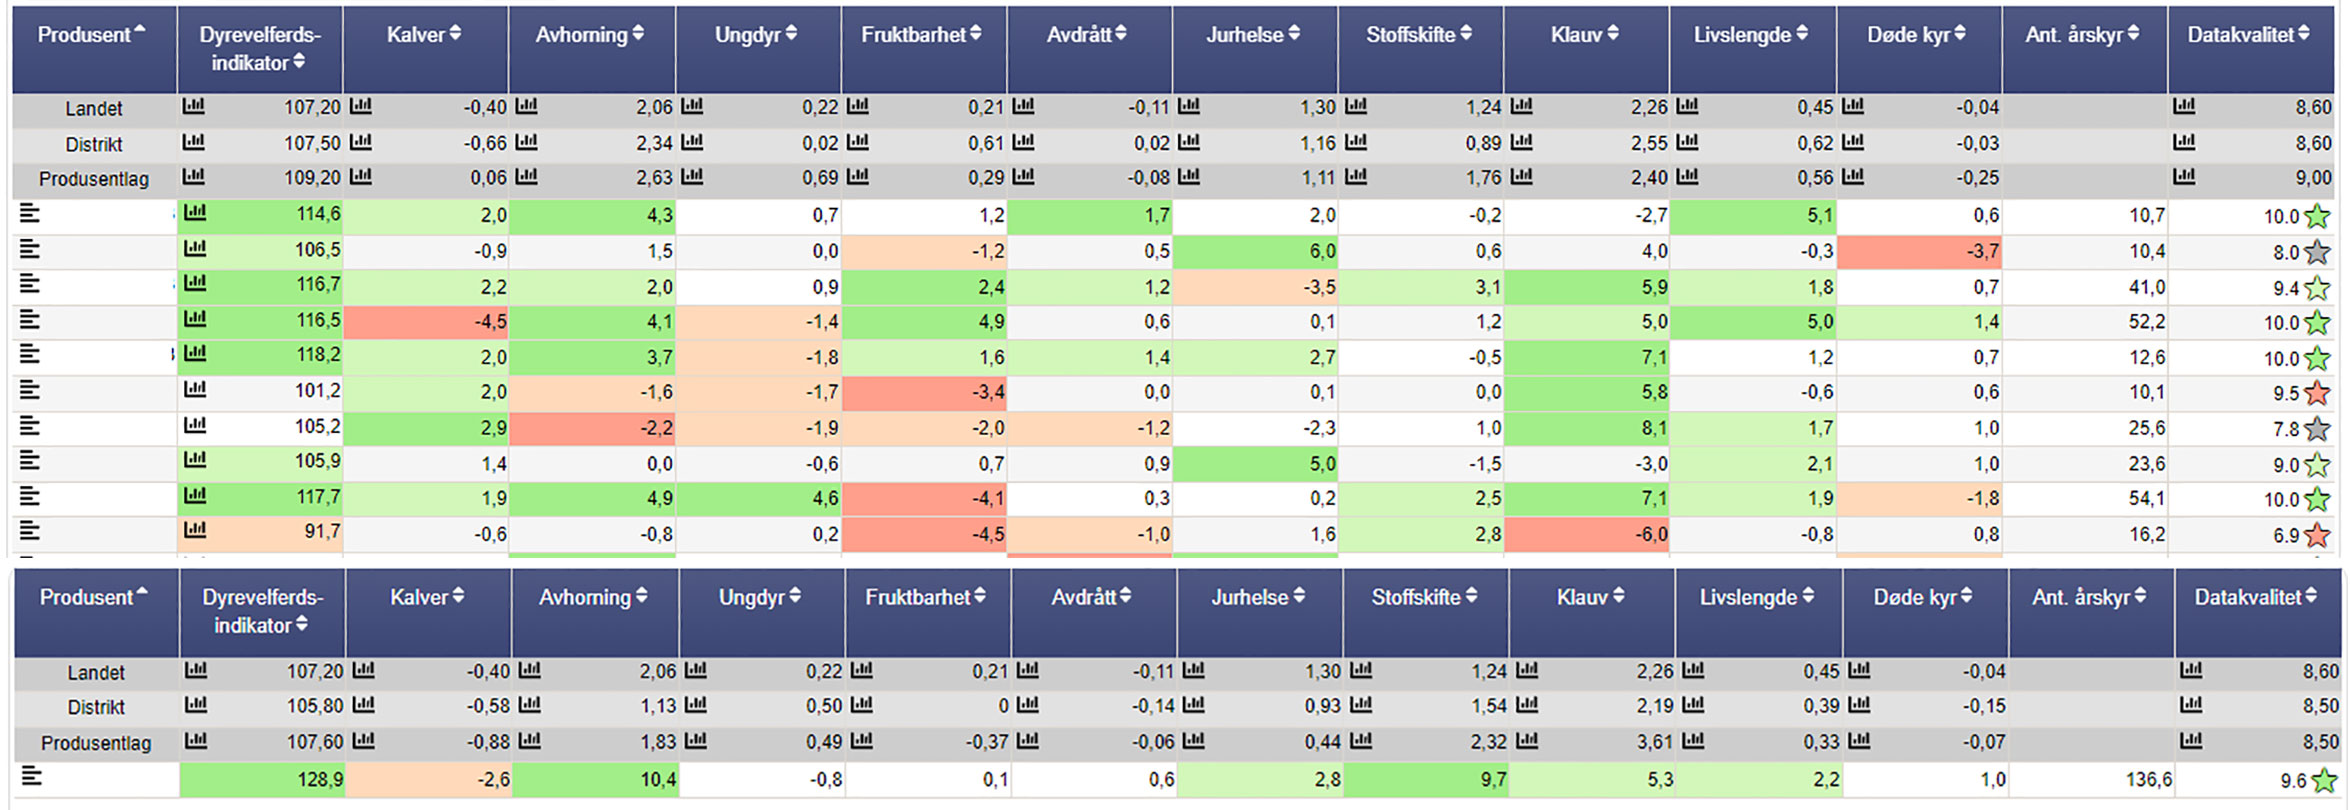
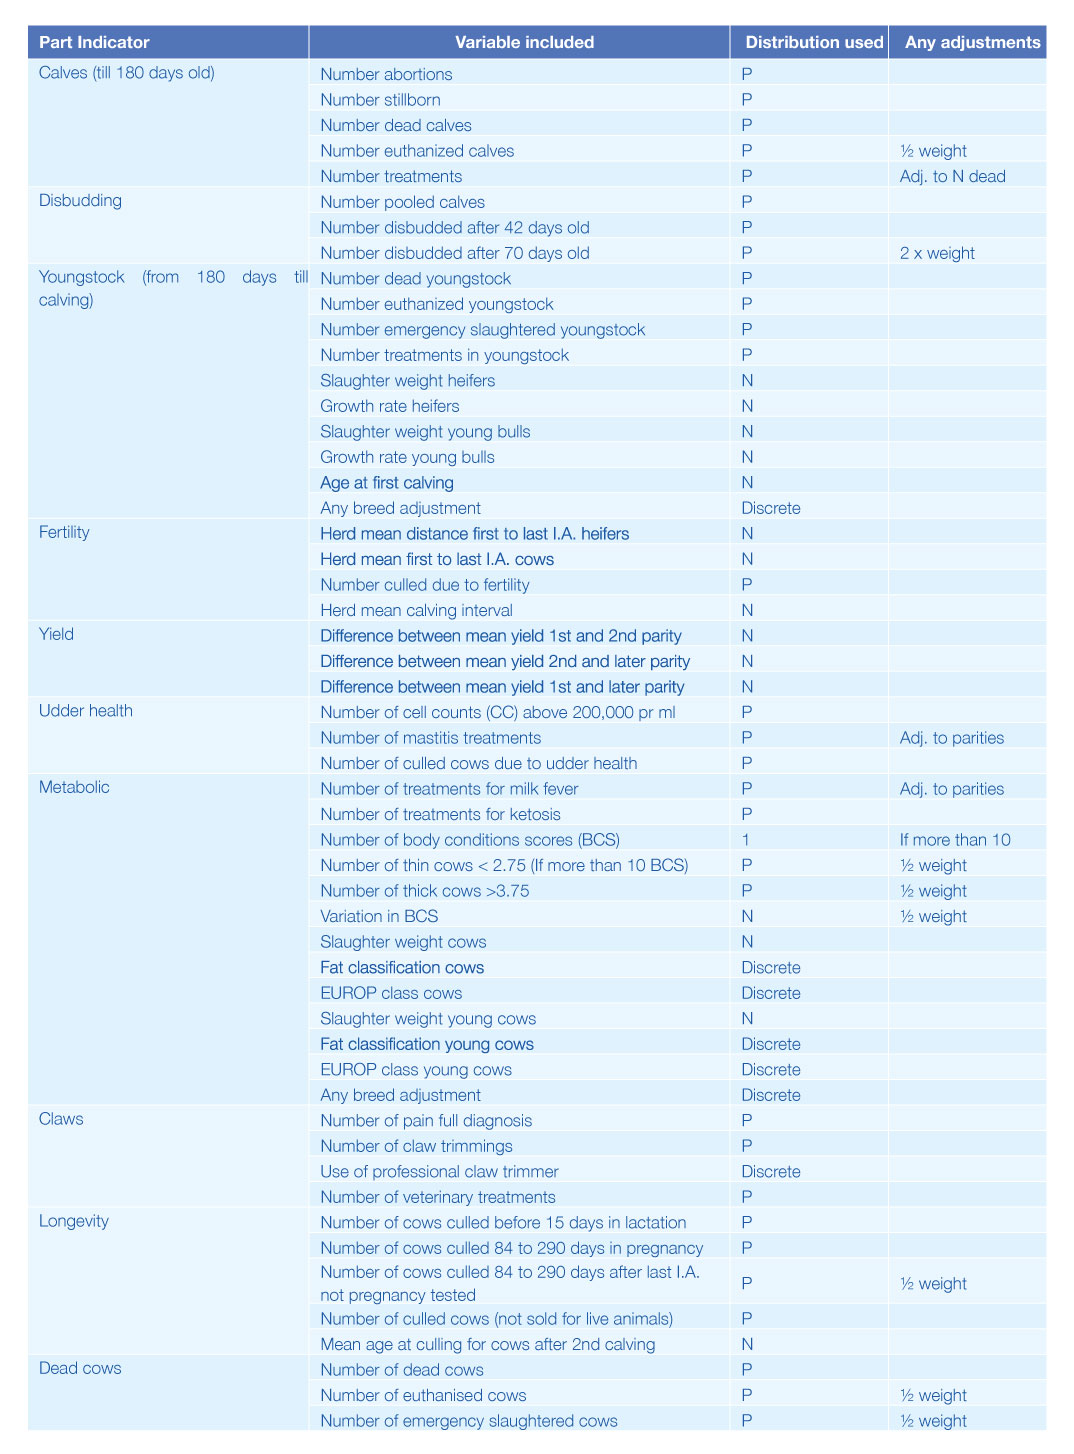
The variables included in the indicator is shown in the appendix at the end. For each part indicator like calves, disbudding etc. the NSD’s are summed up and adjusted so that this sum for the year 2015 is 0.0. This means that all the part indicators are adjusted so the baseline year is zero (see Figure 1 upper line). Finally, all the part indicators are summed up to the total animal welfare indicator, plus 100, so that the baseline is 100.0 in 2015. There is no weighting between each part indicator, so the indicator is not reflecting the true animal welfare, but is made as a tool for each herd to see if this part of the production at herd level has a higher or lower figure than the country mean in 2015. There is also an indication that herds having figures among the 25% best according to the distribution in 2015 is marked light green and if they are among the 10% best, they are marked dark green. In the same way low figures are marked light red or dark red if they are amongst the 25% lowest or 10% lowest compared to 2015 distribution. The design of the indicator is illustrated in figure 1.
The introduction periode
After the prototype was finished, the indicator was tested among 30-40 herds by advisors in TINE using a questionnaire covering different assessments of animal welfare which was not included in the welfare indicator. The advisors did not know the indicator value. After identifying a significant correlation between the NAWI and these assessments the NAWI was programmed by IT-people into the member`s website for TINE`s farmers at the same time as there were several learning courses for producers on the importance of animal welfare in the production system. During 2019 there were 173 meetings with 4,058 producers, and 838 group meetings with 4643 producers where animal welfare was the agenda for the meeting. In these courses also some of the ideas of the NAWI was introduced. This made a good acceptance among producers on the launching of the NAWI in 2020. When the development on the Internet homepage for producers was finished spring 2020, it was established courses for advisors in TINE how to use the NAWI in the advisory work among producers.
After all advisors had been on these courses, they have a one day training by themselves and in groups. Thereafter followed a oneday discussion with the head advisors to understand the figures and calculations as well help to take decisions and have a sound dialog with the producers. These courses are a key when developing new tools, especially in areas as animal welfare assessment which could be quite sensitive. During these courses there were lots of input from experienced advisors on areas where the NAWI could be improved. These improvements were effectuated during spring 2021. After these courses in 2020, the NAWI was launched for producers during the summer 2020.
A simulation model was developed to describe the theoretical potentials for climate. Four example farms (small dairy, large dairy, suckler and dairy bull to beef) were defined based on statistics and to be as representative as possible for the Swedish beef and dairy sector. Certain areas were difficult to quantify and to avoid some complexity farm areas were kept intact from 2015–2030–2050, as well as the number of breeding animals per farm.
It seems like the Norwegian animal welfare indicator is a good tool for making improvements in general animal welfare, and the tool seems to have good acceptance among the dairy farmers.
Olav Østerås Tweet
Experiences and results
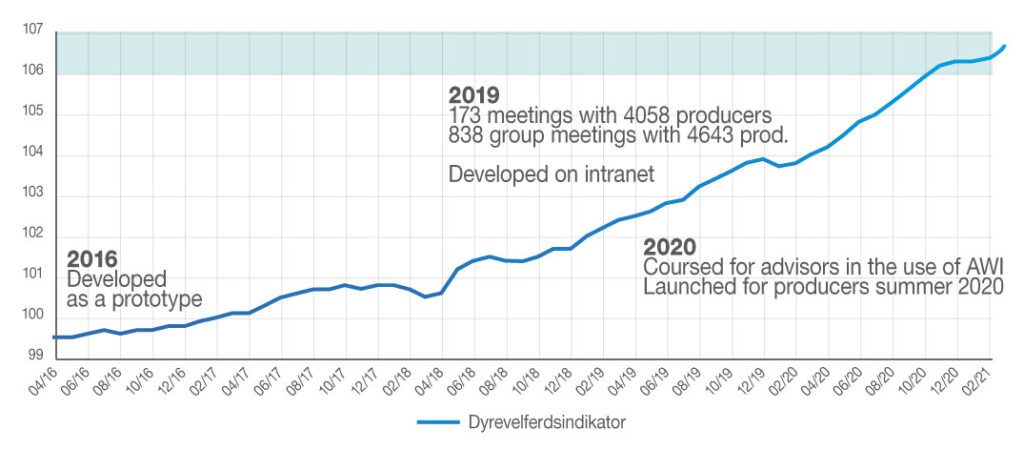
The NAWI had generally good expectance among the producers. Some producers also came up with some proposal for improvements of the indicator. So this launching turned out to be a very dynamic process with constructive feedbacks and adjustments during 2020 and 2021. Figure 2 illustrate the development of the total indicator.
The first year when the prototype was made, the indicator value dropped from 100 till 99.5 in April/May 2016. Later it increased, and the increase really improved during late 2018 and in 2019 when the courses in animal welfare were running for the producers. Still the indicator value for each producer was not known. After launching the indicator for advisors and producers during the summer 2020, the indicator value really increased, and went from around 103 till 107 in May 2021. Interesting there is a drop in March 2020, and around Christmas in 2020, probably due to lockdown according to COVID-19 in Norway. This would be influenced by less claw trimming activity among others. Looking at the different part indicator we can identify that the best improvement is for claw trimming and disbudding of calves. This is natural as these are routines which are quite easy to correct if the producer is aware of it. It is much more difficult to make improvement in dead cows, growth rate etc, which needs more time to adapt to a better management. We could also see that calf health was not improving, but had lower figures. This is probably due to larger herd sizes and more free stalls, which need more attention in prevention of infectious diseases in calves. It seems like the NAWI is a good tool for making improvements in general animal welfare, and the tool seems to have good acceptance among producers.
Introduction courses are very important to prepare and make a good attitude to working with such tools. It is also important to realise that there is a significant relation between good welfare among farmers and good welfare among animals. This is also indicated by the paper of Hansen and Østerås (2019), where the data from the prototype was used to assess this relation. In the future there will be research to evaluate the relation between NAWI and Welfare Quality® Assessment Protocol. If this turns out to be positive, NAWI will be a strong tool to assess animal welfare in dairy production in Norway. The nice thing for the farmer is that this indicator could be made for all herds and updated every month without doing more work than just being a member of the animal recording. Everything is automized from animal recording system. The tool is made to advise and contribute to continuous improvement of animal welfare, and not used for regulatory purposes. For regulatory purposes one must visit the farm and see what is going on in real life. But the tool could be used to advisory work together with the farmer, and it is very easy to identify good and not so good areas in the production.
Summary
The Norwegian Animal Welfare Indicator is developed based on the OIE/ISO standard and using data already existing in the animal recording. It is mainly for documentation and a tool to improve the production system. As such, one should be careful to state that it is directly related to animal welfare, but it is a strong indicator on animal welfare. The tool is made to ease the advisory work at farm level. So far the indicator tells us that in general the animal welfare in TINE production system has improved on a scale from 100 in 2015 to 107 in 2021, and is still on an upward trend.
References
Hansen BG, Østerås O. Farmer welfare and animal welfare-Exploring the relationship between farmer’s occupational well-being and stress, farm expansion and animal welfare. Preventive veterinary medicine. 2019 Oct 1;170:104741.