Share this page
Environmental impact of rotationally grazed pastures at different management intensities in south africa


Alignment with SDGs
AUTHOR
Hendrik P.J. Smit1, Thorsten Reinsch1, Pieter A. Swanepoel2, Ralf Loges1,
Christof Kluß1, Friedhelm Taube1
1Institute of Crop Science and Plant Breeding, Grass and Forage Science/Organic Agriculture, Christian-Albrechts-University Kiel, Kiel, Germany. 2Department of Agronomy, Stellenbosch University, Stellenbosch • South Africa
Abstract
Nitrogen fertilization, irrigation and concentrate feeding are important factors in rotational pasture management for dairy farms in South Africa. The extent to which these factors affect environmental efficiency is subject to current and intense debate among scientists. A three-year field study was conducted to investigate the yield response of different N-fertilizer treatments (0 (N0), 220 (N20), 440 (N40), 660 (N60) and 880 (N80) kg N ha−1 year−1) on grazed pastures and to calculate the carbon footprint (CF) of milk produced. Excessive N-fertilization (N60 and N80) did not increase herbage dry matter and energy yields from pastures. However, N80 indicated the highest N-yield but at the same time also the highest N surpluses at field level. A maximum fertilizer rate of 220 kg ha−1 year−1 (in addition to excreted N from grazing animals) appears sufficient to ensure adequate herbage yields (~20 t DM ha−1 year−1) with a slightly positive field-N-balance.
This amount will prevent the depletion of soil C and N, with low N losses to the environment, where adequate milk yields of ~17 t ECM ha−1 with a low CF (~1.3 kg CO2 kg ECM−1) are reached. Methane from enteric fermentation (~49% ± 3.3) and N2O (~16% ± 3.2) emissions from irrigated pastures were the main contributors to the CF. A further CF reduction can be achieved by improved N-fertilization planning, low emission irrigation techniques and strategies to limit N2O emissions from pasture soils in South Africa.
Introduction
Dairy farmers generally use high amounts of fertilizer to promote pasture growth per hectare, despite the high amounts of manure that is available. However, additional herbage yield response is often not obtained from high amounts of fertilizer [1,2]. Nitrogen fertilization, irrigation and concentrate feeding are key management factors in grazed dairy-pasture systems. However, the extent to which these management factors affect environmental efficiency needs investigation. The growing concern over GHG and the effect of dairy production on the environment has led to the need to express the total emissions associated with milk.
Product carbon footprint (CF) analysis has become broadly accepted as an assessment method. The N-fertilizer management is an important parameter to consider when calculating the CF of milk [3]. The aims of the study were to evaluate dairy-pasture systems in terms of different N fertilization levels on herbage yields as well as calculate the associated CF of milk.
Materials and methods
Experimental field data was used to investigate the effect of mineral fertilizer levels, as management strategies, on the pasture yield and the PCF of produced milk. Field trials were laid out as a randomized block design to evaluate five N fertilizer rates (0, 220, 440, 660 and 880 kg N ha-1 year-1) as treatments, on the CF from irrigated kikuyu-perennial ryegrass (Pennisetum clandestinum-Lolium perenne) pastures. The study was conducted near the city of George in the southern Cape region of South Africa. Plots were 15 × 15 m and replicated in 4 blocks. The study was carried out over a three-year period from April 2016 to June 2019. The additional N-excretion from grazing animals was considered.
Forage quality parameters were estimated using near infrared reflectance spectroscopy (NIRS). The on-farm soil organic carbon (SOC) changes of the tested production systems were also considered and calculated. The global warming potential (GWP) per hectare was calculated using the respective value for each trace gas (CO2 = 1, N2O = 265, CH4 = 28) over a life-span of 100 years [4] and expressed as CO2eq. The efficiency of the different N fertilization strategies, in relation to climate change, was calculated on the basis of the functional unit ECM as proposed by Sjaunja et al. (1990) [5]. The farm-N-balance was calculated using a simple equation which deducts the nitrogen outputs at farm gate from the sum of the nitrogen inputs.
Climate-smart dairy products in South Africa from pasture-based farms can be achieved. The dairy sector continuously strives to use new strategies and innovation to reduce its environmental impact and have a positive impact on our planet.
Pieter A. Swanepoel Tweet
Results


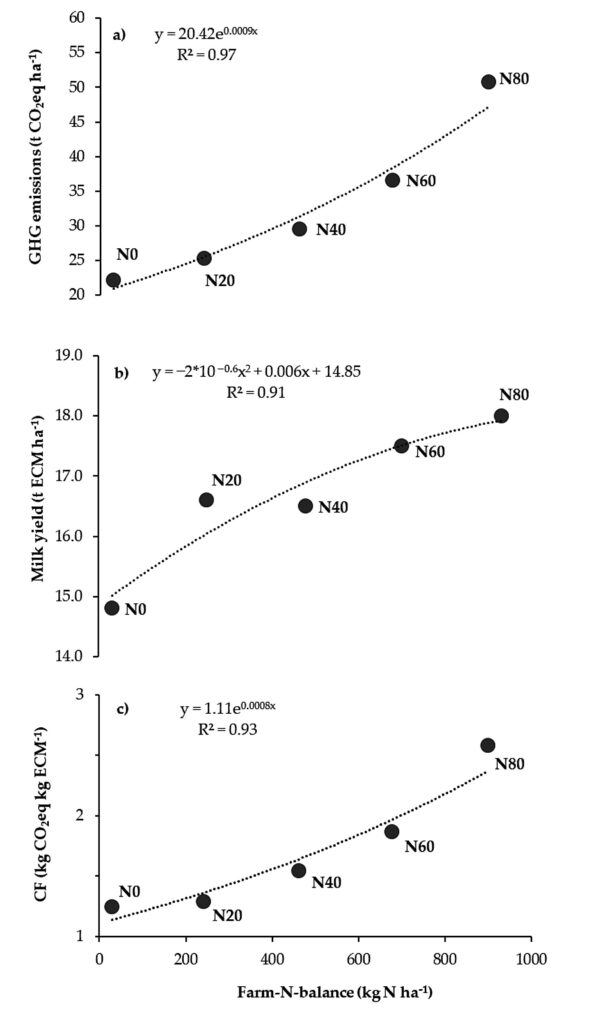
Figure 1. The relationship between a) GHG Emissions (t CO2eq ha−1), b) milk yield (t ECM ha−1) and c) CF (kg CO2eq kg ECM−1) in relation to the farm-N-balance (kg N ha-1) between the different treatments (N0, N20, N40, N60 and N80). Soil carbon changes were considered. Means for the three experimental years are shown (n = 3).
Methane emissions resulting from ruminal enteric fermentation were on average the largest contributor (49%) to the total GWP per hectare over all treatments. Herbage production as a result of pasture management and direct N2O emissions from fertilization accounted for 28% of the total GWP. More than half of emissions in the N60 and N80 treatments were the result of direct N2O emissions from mineral fertilizer applied to pastures and as a result of irrigation. Mineral N fertilizers as inputs accounted for the third largest contributor (12%) of total GWP per hectare. Soil carbon sequestration had a positive effect in reducing the total GWP per hectare over all treatments. The field-N-balance, based on the N in milk yield from pasture and N-returned through animal excreta revealed a range of −119, +86, +299, +501 and +706 kg N ha−1 on pastureland for the N0, N20, N40, N60 and N80 treatments on average over the three experimental years. However, in order to calculate the farm-N-balance, gaseous N-losses were not deducted and therefore the N-losses increased from 31 to 899 kg N ha−1 year−1. With increasing farm-N-balance per hectare, the GHG emissions were generally higher. This relationship could best be described as exponential (Figure 1a). In contrast, the ECM ha−1 correlated linearly with the farm-N-balance (Figure 1b). However, the lowest farm-N-balance (N0 treatment) did not result in the lowest CF (Figure 1c) and were similar between the N0 and N20 treatment.
Discussion
The results from the current study indicated an improvement in the carbon footprint as the amount of N-fertilizer was reduced. The main source of N came from purchased mineral fertilizers. Consequently, the fertilizer and imported supplements were the most prominent factors influencing the field- and farm-N-balance, respectively, as well as the N-footprint for milk. In South African pasture-based dairy systems, cows graze pastures year-round, which makes high N returns to pastures more likely. Dairy cows excrete ~75% of their N intake, whereas less than ~25% is metabolized into the milk output from the pasture system [6]. Even if concentrates are fed at low levels there will still be a considerable amount of N returned through excreta. Therefore, excreta should be considered in fertilization management strategies. The CF of milk from pasture-based dairy farms can be further improved through management such as timing of fertilizer application, reducing the amount of fertilizer applied, and by incorporating forage legumes. This study indicated that the excess N applied (>220 kg N ha-1 year-1) in combination with excreta on pasture-based dairy farms have no beneficial effects on herbage yields and therefore contribute to negative environmental effects as well as the CF of milk.
This study gave insight about the opportunities to produce climate-smart dairy products in South Africa. Regional developed values for the different parameters considered in the study could further update the accuracy of the calculated CF of milk from pasture-based systems in South Africa.
Conclusion
Applied mineral fertilizer (imported N onto the farm) contributed the largest fraction from the inputs category affecting the CF. The CF increased as the amount of added N fertilizer increased. An increased herbage yield was not observed when high rates of N fertilizer were applied and a low rate of mineral-N fertilization resulted in the lowest CF in this study. However, a level field-N-balance should be sought in order to sustain high yields and forage quality in the long-term. Fertilizer-N rates in excess of the N20 treatment used in this study are unlikely to provide a cost-effective response on grazed pastures and will only increase environmental impacts. The opportunity exists in pasture-based dairy farms to reduce further the environmental impact of milk production by optimizing efficiency as well as by management strategies to prevent over-fertilization or feeding excessive amounts of purchased concentrates. The contribution of irrigation played an important role in calculating the CF and the careful timing and application thereof could lead to a lower CF. This will ensure that pasture-based dairy farms can potentially mitigate the CF of milk in a profitable manner.
The work presented here is based on the original article of Smit et al. (2021) [7].
This research received financial support from Milk South Africa. H.P.J.S. is supported by the Evangelisches Studienwerk Villigst foundation. The Western Cape Department of Agriculture and Stellenbosch University also contributed to the project.
References
Viljoen, C., Van Der Colf, J., Swanepoel, P.A. Benefits Are Limited with High Nitrogen Fertiliser Rates in Kikuyu-Ryegrass Pasture Systems. Land. 9:173 (2020).
Smit, H.P.J., Reinsch, T., Swanepoel, P.A., Kluß, C., Taube, F. Grazing under Irrigation Affects N2O-Emissions Substantially in South Africa. Atmosphere. 11: 925 (2020).
Henriksson, M., Flysjö, A., Cederberg, C., Swensson, C. Variation in carbon footprint of milk due to management differences between Swedish dairy farms. Animals. 5: 1474–1484 (2011).
IPCC. Climate Change 2014: Synthesis Report. Contribution of Working Groups I, II, and III to the Fifth Assessment Report of the Intergovernmental Panel on Climate Change; IPCC: Geneva, Switzerland. (2014).
Sjaunja, L.O., Baevre, L., Junkkarinen, L., Pedersen, J., Setala, J. A nordic proposal for an Energy Corrected Milk (ECM) formula. In Proceedings of the 27th Session International Committee for Recording and Productivity of Milk Animals, Paris, France, 2–6 July (1990).
Luo, J. & Kelliher, F. Partitioning of Animal excreta N. into Urine and dung and Developing the N2O Inventory; Ministry for Primary Industries: Wellington, New Zealand. pp. 1–19. (2010).
Smit, H.P.J., Reinsch, T., Swanepoel, P.A., Loges, R., Kluß, C., Taube, F. Environmental Impact of Rotationally Grazed Pastures at Different Management Intensities in South Africa. Animals. 11: 1214 (2021).


