Share this page
Determination of environmental and economic outcomes of dairy production systems in South Africa
a system dynamics approach
Alignment with SDGs

AUTHOR
Riana Reinecke, James Blignaut Asset Research, Pretoria • South Africa
Abstract
The dairy sector must demonstrate its positive contributions toward sustainable production through sharing science-supported and evidence-based information. It must do so in conjunction with assisting dairy producers in reducing their on-farm environmental impacts. This should be done in a manner that would lead to a more robust, profitable and resilient farm.
Milk SA recognised the urgency of the dual need for improved on-farm management and the timely dissemination of information that will not only protect the dairy sector and its producers, but also enhance its long-term environmental and financial sustainability. Milk SA therefore initiated a project in conjunction with ASSET Research to develop a web-based system dynamics tool which assists milk producers to calculate and evaluate their on-farm carbon footprint.
This tool enables producers to take informed action, and to implement correctional changes which contribute towards lowering their emissions. The tool was tested and calibrated on seven South African dairy farms and proved to be both practical and applicable, with the required data readily available.
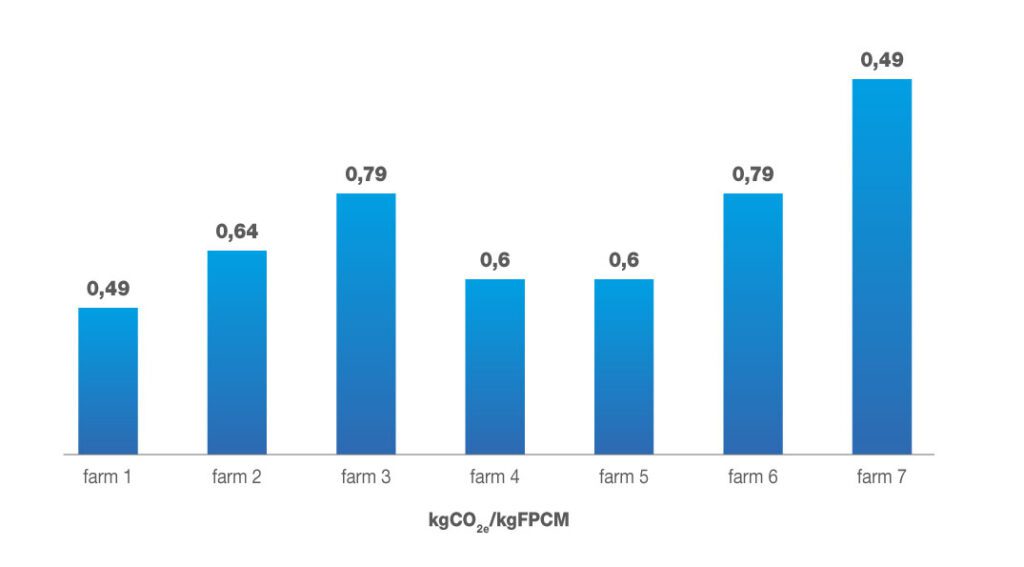
The results were calculated, among others, in terms of fat and protein corrected milk (FPCM) produced and expressed in terms of kg CO2e/kg FPCM. Results varied between 0.49 and 1.14 kg CO2e/kg FPCM/kg, using a GWP* of 8 as the warming potential for CH4; the results compare favourably to international standards.
Introduction
Dairy farmers face a variety of daily production realities (such as biosecurity concerns, animal welfare and management issues), the rapid increase in the cost of external inputs and the consequences of erratic climatic conditions, but the producer must also overcome an increase in negative perceptions among consumers concerning dairy per se. These perceptions, especially on social media platforms, have become extremely pervasive in generating a negative sentiment concerning dairy, mostly with respect to the sector’s perceived greenhouse gas (GHG) emissions.
While the negative, and often false, publicity must be countered it does not exonerate the dairy sector from improving its management to reduce the sector’s environmental footprint. Both the producer and the sector must act urgently and do so in a science-informed and evidence-based manner taking cognisance of the complex and dynamic milieu in which it operates.
Materials and methods
The web-based tool is freely available and requires the user to complete the online questionnaire, which is supported by a user manual. The tool is divided into five sub-models which act interdependently and can be applied to analyse various on-farm aspects such as herd management, herd energy use and flows, emissions, etc. An initial assessment is then produced and reported as the baseline footprint of a specific farm. This can be extended with subsequent management scenarios, or by means of revisions over time. Given the interdependency of the various sub-models, all the information flow into the output of this model, including the methane (CH4) emissions which are generated from enteric fermentation processes and manure management, nitrous oxide (N2O) emissions from soil and manure management, and carbon dioxide (CO2) emissions from direct sources. Based on the management practices implemented on the farm, different GHG emission trajectories are therefore calculated. Furthermore, the economic sub-model provides additional insight into the potential benefits or impacts any changes may have. To enable this advantage, the model allows the user to create different scenarios to anticipate the effects that specific changes might have on the emissions as well as the associated economic impact thereof. This enables producers to develop effective mitigation strategies, to evaluate the impact of decisions, and to communicate with stakeholders such as consumers, about their real impact on the environment.
This online system dynamics tool will assist producers to estimate their emissions, and to track change over time, while indicating several ways in which emissions reductions can be brought about.
Riana Reinecke Tweet
Results
The model was tested on seven farms in South Africa. The number of productive cows on these farms varied from 260 to 2 460 and the average milk production ranged from 4 500 to 8 150 kg/cow/year. The application of N-fertiliser, both from synthetic and organic sources, ranged between 27 to 600 kg N/ha/year. The results were estimated, among others, in terms of fat and protein corrected milk (FPCM) produced and expressed in terms of kg CO2e/kg FPCM. The results varied between 0.49 and 1.14 kg CO2e/kg FPCM/kg (see Figure 1). A global warming potential of 8 for CH4 is used, which is also called GWP* in accordance with Blignaut et al. (2022). The results compare favourably to international standards.
The research also indicated that the environmental sustainability of a dairy farm and its profitability are not conflicting objectives. The farm that showed the lowest emissions per kg FPCM, Farm 1, also had the highest profit per kg FPCM. These results were confirmed by site visits and on-farm investigation that confirmed that the farm management implemented various measures to improve efficiency before the commencement of the project. The farm management has a policy of implementing strategies to reduce the environmental impact on an ongoing basis.
Discussion
A freely available web-based tool has been developed to assist producers in estimating their carbon footprint and offering guidance towards reducing their emissions. Opportunities for such reduction include improving feed efficiencies rates, improving herd management strategies and increasing productivity. This, in turn, also has an impact on the profitability of the farm. The tool, for example, calculates the protein intake from both procured feed and farm-produced feed. Depending on the forage type, the protein content will be calculated in the model. The evaluated farms indicated that farms with the highest protein intake did not reflect the same results with N-excretion rates. This can be a result of total protein intake and protein percentage in the milk. The opposite was also seen where the average protein percentage on the farm was low, but because of lower milk protein and higher feed intake, the N-excretion rates were slightly elevated in comparison. This suggests possibilities in enhancing the feed efficiency to lower emissions on the farm, and consequently, influencing the economic output of the farm. The same is true for fertiliser application. It was not the farm with the highest N-fertiliser rates that performed the best, but rather where it was applied according to measured recommendations and where more focus was given on precision management.

Conclusion
This study indicated that the on-line tool could assist producers to calculate the emissions from a dairy farm, identify the critical environmental indicators and simulate scenarios to determine the best and most profitable mitigation strategies. Producers can also track progress over time which can be used to report on actual data. The tool is, however, not static and is under continual development based on feedback from users and the inclusion of new and improved science. In one such development, the tool will be expanded to include the on-farm carbon capture and storage opportunities that exist.
In conclusion, the dairy industry has an important role to play in both combatting misinformation about the sector, and in advancing the reduction of the environmental footprint of dairy farms. This online system dynamics tool will assist producers to estimate their emissions, and to track change over time, while indicating several ways in which emissions reductions can be brought about. Being environmentally prudent also has financial benefits. The tool embraces the adage that to measure is to know; and knowledge is power – power to assist change and to communicate such change to an increasingly informed public audience.
References
Blignaut, J.N., Meissner, H.H., Smith, H., Du Toit, L. An integrative bio-physical approach to determine the greenhouse gas emissions and carbon sinks of a cow and her offspring in a beef cattle operation.